When switching on the oxygen pumps, there was an explosion on board of the Apollo 13 space craft. A short circuit in a small module led to an explosion rendering most of the space craft useless.
For days, the crew frantically worked in cramped quarters trying to return to Earth. Tensions ran high, but, instead of blaming each other for the mistakes they made, they concentrated on the system of the space craft and how to work with what was left of it. Only that broad, holistic focus on the system let them survive.
The same is true for your development process. Focus on the whole system instead of blaming each other for slow releases of new features. Value-Stream-Mapping can help you shift your focus from fixing individual shortcomings to the optimizing the entire system.
Value-Stream-Mapping is a lean technique
It visualizes the whole process from idea to customer release as a series of connected tasks. Both value and non-value adding tasks should be defined and tracked from customer requirement to delivery.
By looking at the holistic representation of your complete development cycle, and whether or not the individual steps are adding value, you can create a visual model of your process and easily identify waste in the system.
How do you make waste visible?
To draw a Value-Stream-Map, everyone involved in the process comes together. Choose one feature you recently worked on. Try to remember the exact steps which resulted in the finished feature:
- Who had the idea and when?
- How long did it take to decide to actually do it?
- What exactly was the first action taken to start design?
- How long did the design take?
- When did the developer get assigned the new feature?
- …
And so on – all the way to release and successful customer adoption.
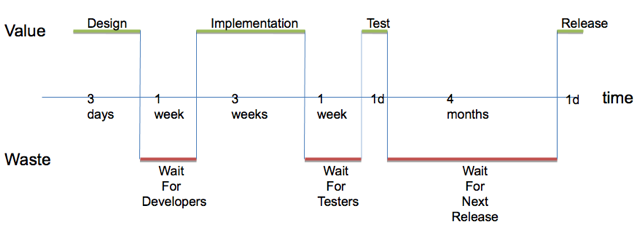
You’ll come up with a long, chronological list of actions and waiting times between those actions. Now draw that sequence as a step-diagram. Put the actions as lines above the ground line. And put the waiting times as lines below the ground line. Mark actions in green and waiting times in red for better visibility.

Now, you’ve got a visual representation of how that one feature came into existence. The longest waiting times (waste) should quickly become obvious.
Just seeing those long waiting times starts the discussion
Suddenly, operations folks will talk with QA and developers. How can we shorten that big gap? Can we skip it entirely? Everyone is engaged, because you’re trying to tackle an obvious problem instead of finger pointing.
Value-Stream-Mapping makes it visible that the biggest problems aren’t individual people, but the system they work in. It’s obvious that finger pointing does not address the biggest issue. Instead, everyone focuses on how to improve the system.
We had a whopping 18 months of accumulated waiting time
It was a typical feature we mapped out. While the actual time we worked on the feature was measured in hours and days, the waiting times between the steps were weeks and months. The biggest gap was created by our 6-month release cycle. It was adding at least three months of waiting time to every feature. And if a feature request came in just before the previous release, it waited for over six months.
It was immediately obvious that it wasn’t the fault of the consultants or the developers. It was the fault of our system having only two releases a year. Immediately, we stopped blaming each other and focused on the problem at hand: how could we reduce those long release cycles?
It didn’t take long and everyone agreed: Let’s try two month release cycles instead of six months. The risk seemed great, but the reward greater. Everyone was committed to the goal and we took that leap of faith.
It was a hard and bumpy ride – nearly breaking our necks – but it forced us to improve our work so that we survived those two month release cycles. A few releases later, surviving became thriving and we ditched the cycles in favor of continuous releases.
But continuous releases must have brought down your quality
Yes, quality was a major issue in the early days. Initially, we stuck to manual regression testing cycles – each one a couple of weeks long. But not very helpful. We found out that by releasing every two or three days we had fewer bugs which were much easier to locate and fix. So from the customers’ view our quality went up.
Our customers didn’t have to fear those huge releases with hundreds of bugs we pushed down their throats periodically. Instead, we released a small feature and a few bug fixes every other day. Major customer complaints all but vanished. On the contrary, they were thrilled to get their features and bug fixes within weeks instead of months or years.
Cut out waste by doing Value-Stream-Mapping
Gather everyone involved in bringing a new feature to your clients. Time all product development actions and the waiting time between those actions. Draw them on a step-graph and identify the biggest waiting time. Discuss how to change the system rather than blaming individuals for the delay. Only then can you reach your destination in one piece as the Apollo 13 astronauts did.

One thought on “How Value Stream Mapping can speed up your cycle time from years to weeks”